Perform disk usage and statistics.
1.High capacity folder
A pie chart of the high capacity folder is displayed.
2.High capacity extension
A pie chart of the high capacity extension is displayed.
3.Extension of many files
A pie chart of the many file extensions is displayed.
4.Aggregate media files
A bar chart of the aggregated media file is displayed.
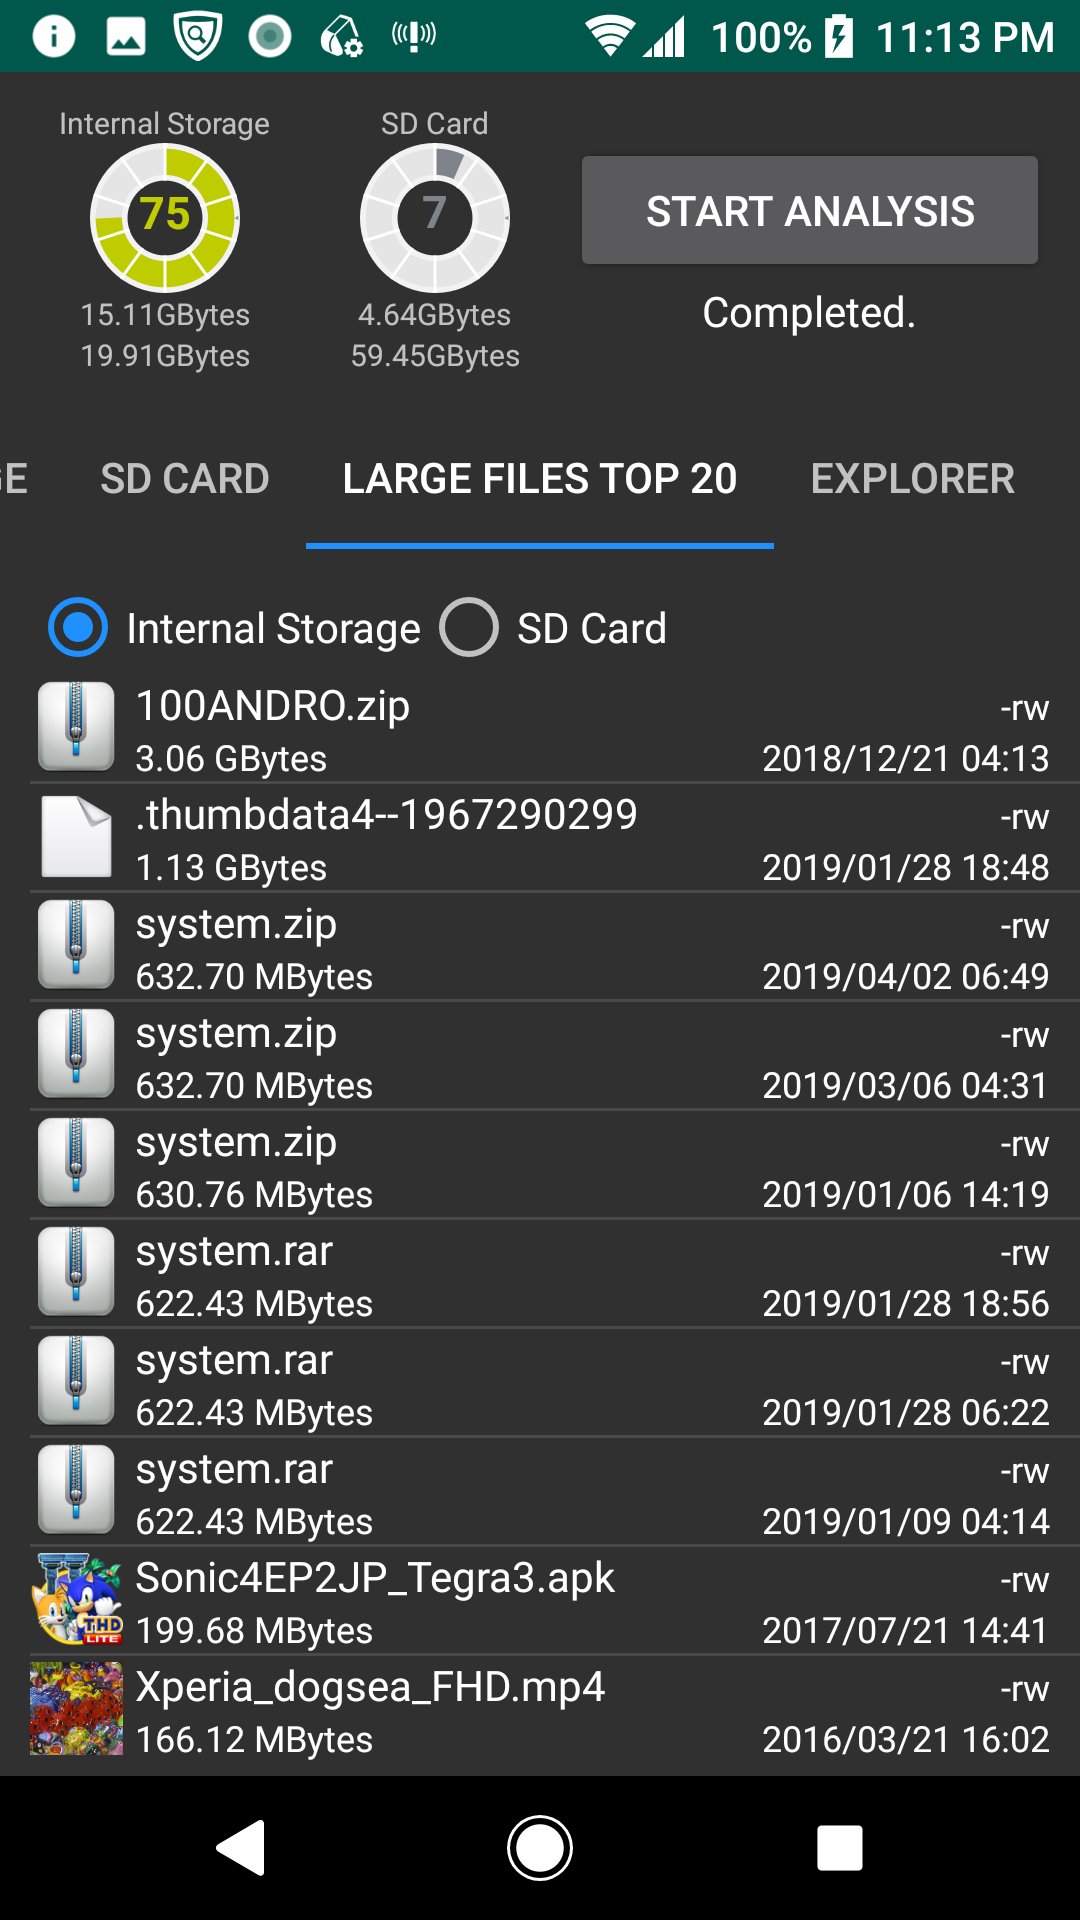
5.Large Files Top 20
The TOP 20 of the large file is displayed. You can also delete it.
6.Explorer
You can check the capacity with Explorer. You can also delete.
7.Cache delete
A list of applications with cache is displayed, and you can clear the cache.
*Since the difference after deletion processing is not reflected in the chart and disk usage gauge, please start analysis again.
Last updated on Aug 19, 2020
이 버전에는 사소한 버그 수정과 전반적인 개선 사항이 포함되어 있습니다. 최상의 환경을 위해 최신 버전으로 업데이트하세요.





APKPure - 안드로이드를 중심으로 한 멀티플랫폼 앱스토어로, 다양한 앱 관련 콘텐츠를 제공합니다. 더 쉽고, 빠르고, 안전하게 원하는 앱을 찾아보세요. 빠르고 효율적인 다운로드와 설치가 가능합니다.