Package Name:cz.chladek.profiler
SHA-256:6ded3542ea01747e382b460aad4931af4cce950caf50092ec3ba17d31fcdb22f
Show More
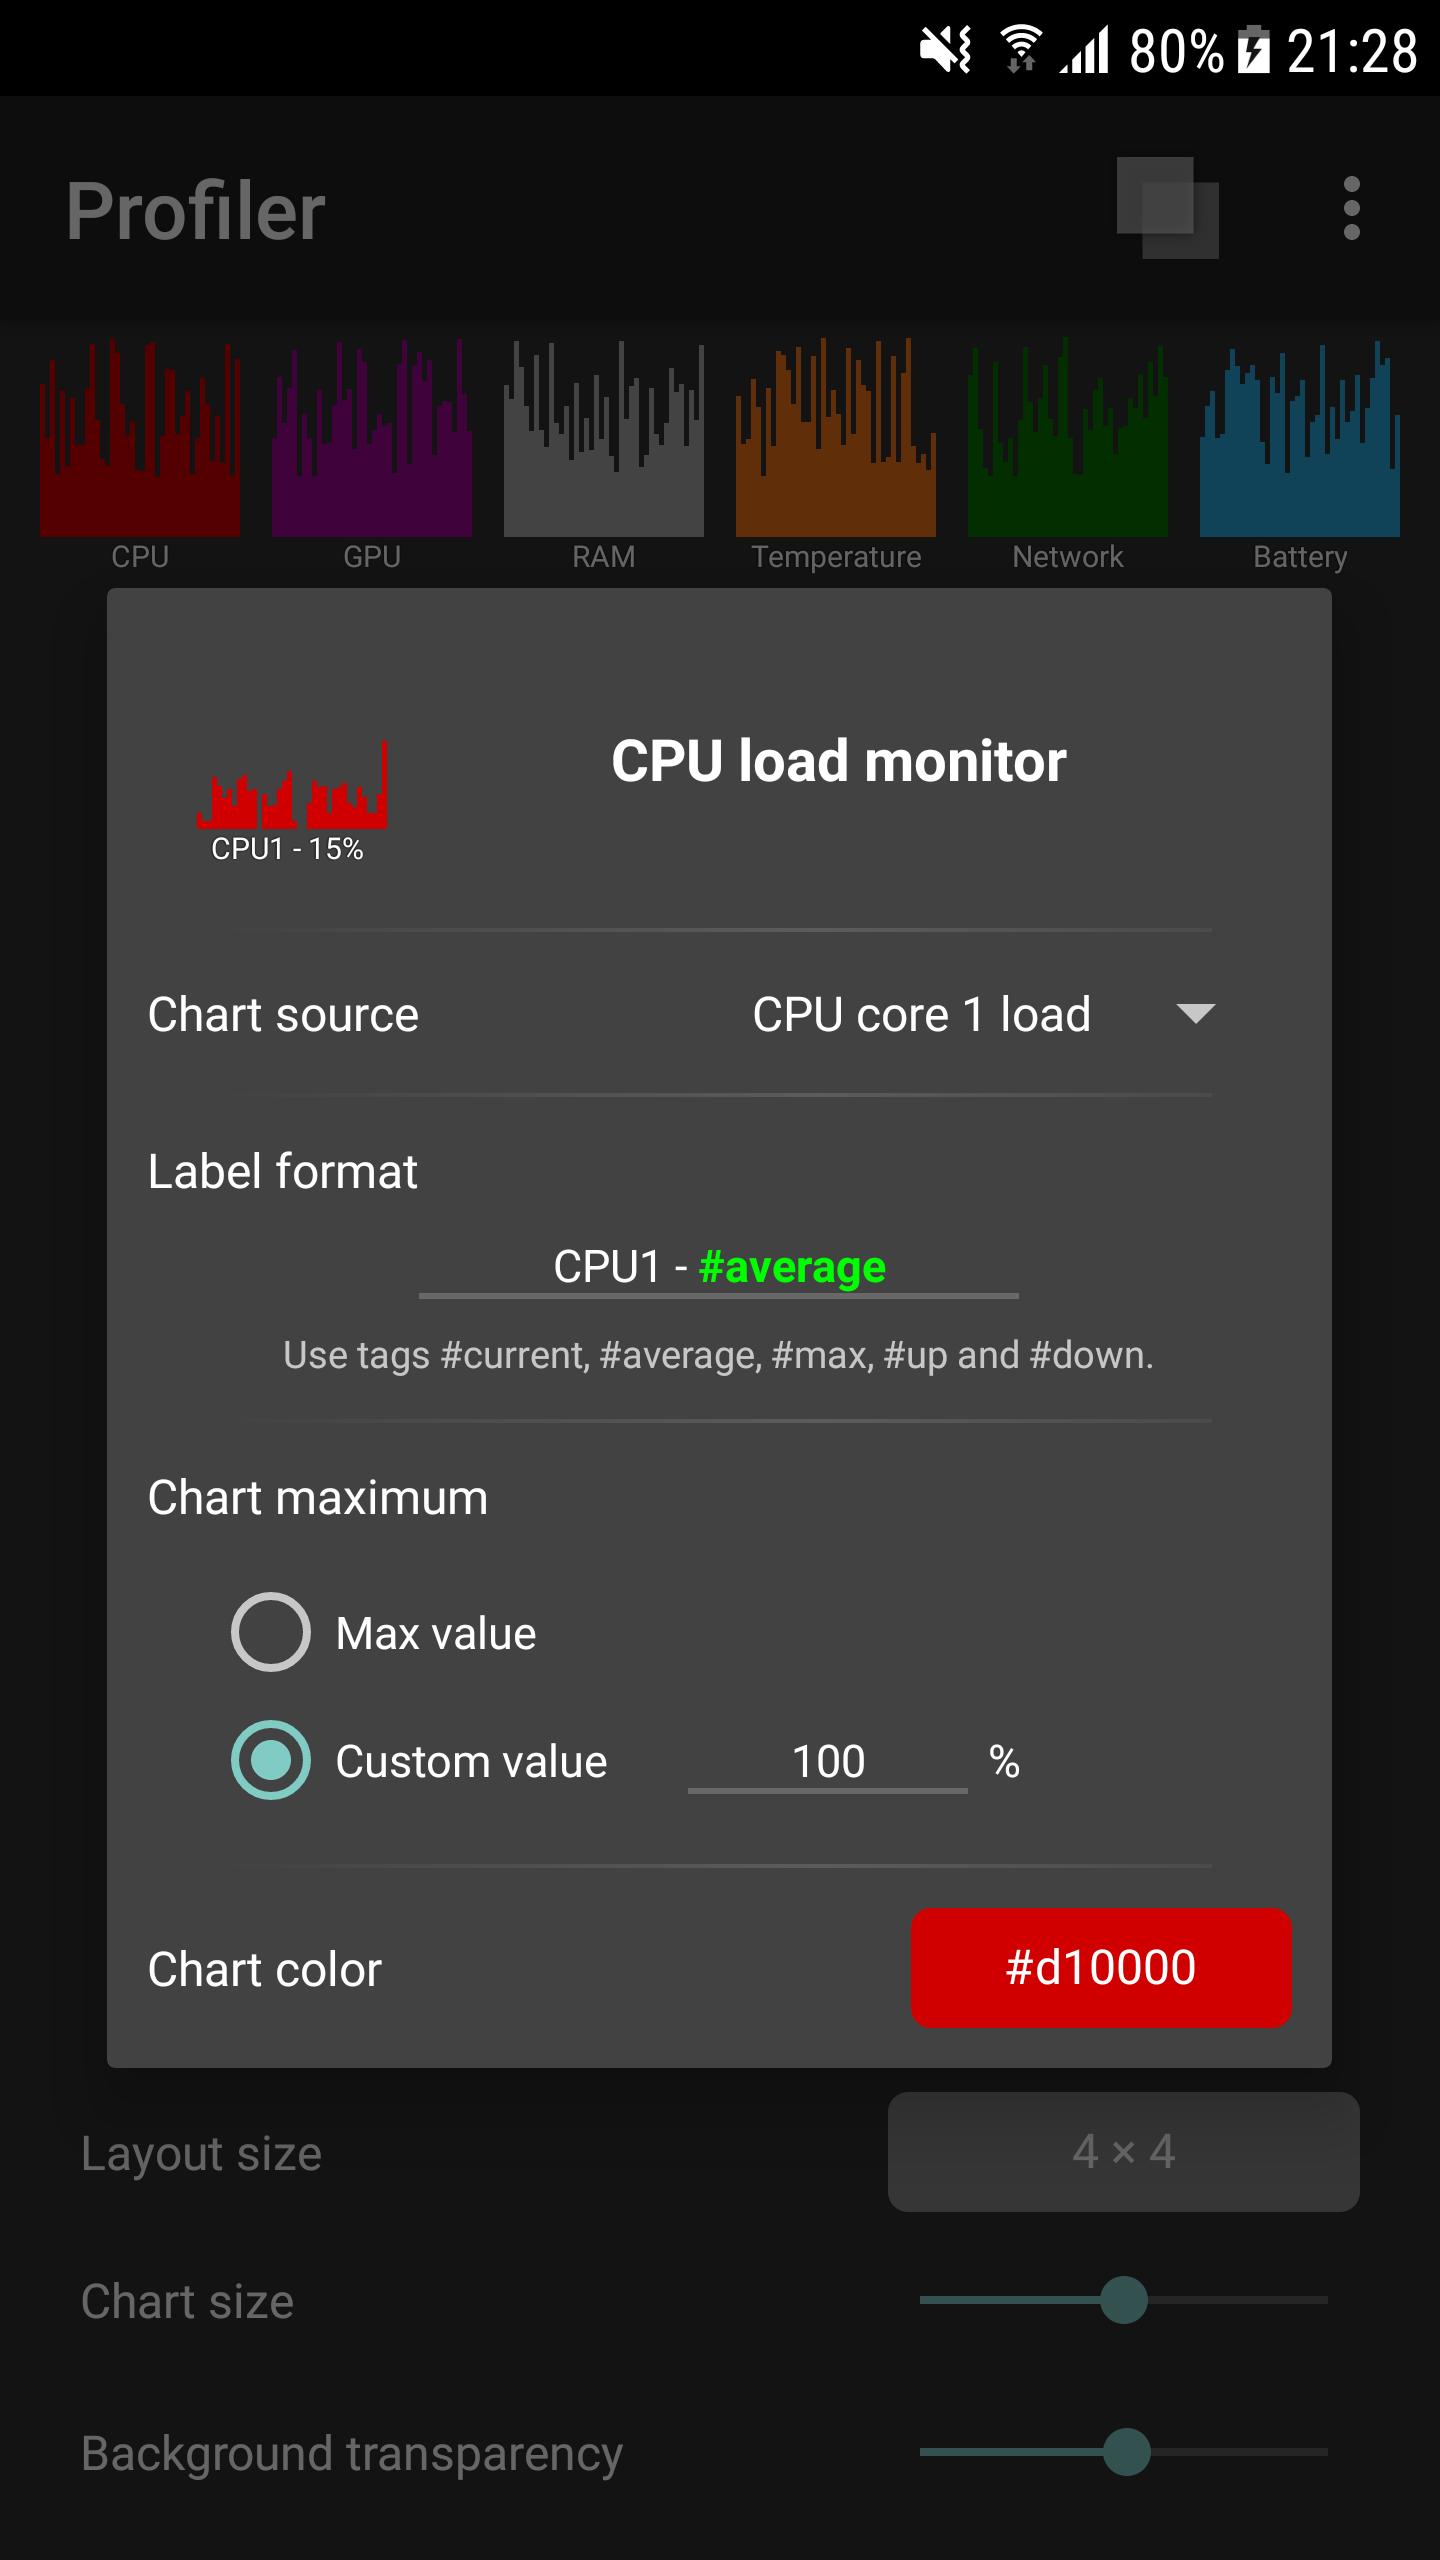
Real-time component monitoring in floating window. You can customize layout, its size and transparency. You can set your prefered data format and chart color for better clarity.
Supported components:
• CPU load and frequency
• GPU load
• RAM usage
• Network traffic
• Temperature
• Battery voltage, temperature and current
Depends on data provided by your device.
Supports API to control Profiler window in your application. ProfilerAPI on GitHub
If you want to translate this application into your language, here you have, what you need.
Device compatibility list.
Latest Version
1.5.6Uploaded by
Makaveli Shakur
Requires Android
Android 5.0+
Category
Free Tools AppContent Rating
Everyone
Security Report
Check Now
Report
Flag as inappropriateLast updated on Mar 20, 2021
- Romanian translation by Dragomir Gabriel
- Bug fixes


APKPure - A multi-platform app store primarily focused on Android, providing extensive app-related content. Discover the app you want easier, faster, and safer, with quick and efficient downloads and installations.