Processes
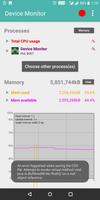
You can see the total CPU and memory usage of all processes currently running on the system.
If the device has more than one core the CPU usage will be the sum of all cores\' CPU usage.
Add processes by pressing \'Choose other process(es)\' button.
Device Monitor process will always be shown in the list. Switch between CPU and memory usage by pressing the \'Memory\' button.
The memory monitored and shown by Device Monitor is the Total Private Dirty.
If Android kills a process due to low memory
or the process finishes itself, \'DEAD\' will be shown.
You can disable or re-enable showing the process on the graph by pressing its label.
You can remove the process from the list by performing a long press on its label.
\n\nIn order to get CPU usage the app does not make use of the \'Top\' Linux command but instead it parses the
\'/proc/stat\' file and does calculations with the user and system time.
\n\nMemory
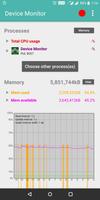
\n\nDevice Monitor shows on screen the device\'s most relevant memory parameters. They are both parameters related with Linux and Android:
\n\nMem used: the memory which is already in use by the system.
\n\nMem available: the available memory on the system. This number should not be considered absolute: due to the nature of
the kernel, a significant portion of this memory is actually in use and needed for the overall system to run well. Mem available is
the sum of MemFree and Cached.
\n\nMemFree: The sum of LowFree plus HighFree (not shown on the graph since they\'re not relevant in terms of app developing).
By default this parameter is disabled on the graph.
\n\nCached: in-memory cache for files read from the disk (the pagecache). By default this parameter is disabled on the graph.
\n\nThreshold: The threshold of Mem available at which Android considers memory to be low and start killing background services and other
non-extraneous processes. This is a parameter exclusive for Android not present on Linux.
Recording
\n\nDevice Monitor can record in a CSV file the CPU usage and memory values for later usage and processing in a spreadsheet program.
Just press the circular red button on the main window to start recording. Then you can select and add other app process
to the graph by pressing the \'Choose other process(es)\' button and then bring the app to the foreground. Device Monitor will record the CPU usage of that app while it is being used.
To stop recording just press the white square icon or press the \'Stop and save\' action button from the Device Monitor entry in the system bar.
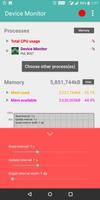
Values will be recorded at the pace indicated in the \'Read interval\' setting of the \'Settings\' panel.
\n\nWhen recording, Device Monitor writes all the CPU usage and memory parameters to disk no matter whether they are being shown on the graph or not.
\n\nThe recorded files are saved on the SD space of your device in the \'Device Monitor\' folder.


